
Integrators are no strangers to collecting data. Canary, Ignition tag historians, SQL servers, even Excel sheets can be used to gather important information for clients’ systems. Organization can get tricky, though, especially when you’re pulling in information from multiple data sources. What if there was a way to place all this data into a singular, easy-to-use tool?
Turning Data into Actionable Information
Enter Flow Software. Acting as, in Flow’s own words, “the link between your historians and boardroom”, Flow is an information platform that promotes informed decision making in business and industry. It’s a “one-stop-shop” that collects, standardizes, and visualizes your data all in one convenient and easy-to-use place.

Below, we’ll highlight some of the main advantages of using Flow in your industrial automation projects and how it’ll make your life easier.
Agnostic Data Collection
Comparing data from multiple different sources was initially difficult, but Flow fixes this by being “data source agnostic”, meaning that data in Flow is formatted identically regardless of where it’s coming from. What matters is that the data is all there and can be easily used and manipulated.
• Easily connect to a variety of existing data sources.
To start off, all Flow needs from its data sources are the address, the title, and any valid user credentials. Once this is plugged in, Flow then gives you access to the namespace of the data source exactly how it originally appeared. For instance, with Ignition’s Tag Historian, Flow will display the entire tag tree just as it was displayed from its native source.
• Enter data directly into Flow client forms.
End users can enter data directly into forms, giving them the ability to both update and contextualize data using comments at the same time they’re viewing it. After Flow is up and running with your data sources, you can start using measures.
• Data is reporting-oriented.
Measures aggregate data from specific tags or records into calendar-oriented “time buckets” as they are referred to. This can be categorized by shifts, months, or years to give you a birds-eye-view of your data.
Data Integrity & Timestamping
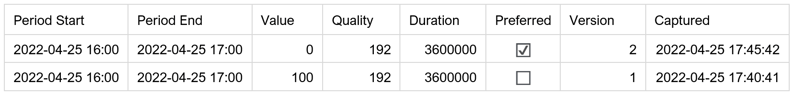
While it’s fine and dandy to have this data flowing, it’s important to make sure all that data is accurate. After all, why would any of this matter if the information you’re using isn’t correct? Flow does an exceptional job of keeping a thorough audit trail of the “who, what, when, why” for data edits and ensures the data you’re using is not only accurate but consistently updating if any changes are made to its original source.
• Track changes with a thorough audit trail.
To begin with, any time a record is removed or updated, Flow records that change and archives the original inactive value, stating why the change was made, who made the change, and when it was made. This information is kept in the same SQL database that manages the rest of the flow instance and can be retrieved or restored at any time.
• Flow keeps a “single point of truth.”
Tying these data sources into a single architecture maintains what Flow likes to call a “single point of truth”. For example, other reporting systems try aggregating raw data when you load any reports and dashboards for a specific date range, and it normally leads to results that aren’t 100% accurate. Since Flow places your aggregated data into time buckets, you get sets of data that are reliable and consistent.
Faster Data Calculation
So now you have all your data reliably stored within Flow. What can you do with all this data? Flow gives users a wide array of options to manipulate data.
• Standardize your calculations by using templates.
Any calculations you make with your data can be standardized and applied on a broader scale by using standard definitions. Users can create definitions for things like “efficiency” or “utilization”, which may be different depending on your project. Flow gives you the chance to not only modify but standardize these definitions so they can be applied to multiple instances.
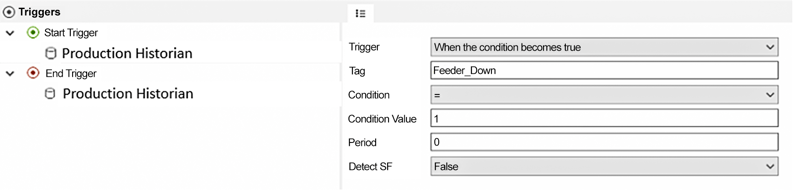
• Add context to your KPIs by using events.
You can also grant more context to KPIs (key performance indicators) by tying them to a certain “event”. Events are user-defined time periods that contain relevant contextual information (compared to calendar-based periods). These user-defined periods also have user-defined start and end triggers. For example, you can define an event that captures machine status. You can then use this event to gather data and perform aggregations on how the plant is impacted when the machine is running, idle, or down.
• Compare to limit and target values.
In Flow, it’s easy to scale up analysis of a given KPI over longer time periods. Say you’re collecting a given measurement in a minute-interval time bucket. Flow can zoom out and see how exactly that metric is performing over a given shift, week, or year.
The way Flow handles all these calculations saves heavily on resources, especially compared to you attempting to perform the aggregation on the fly.
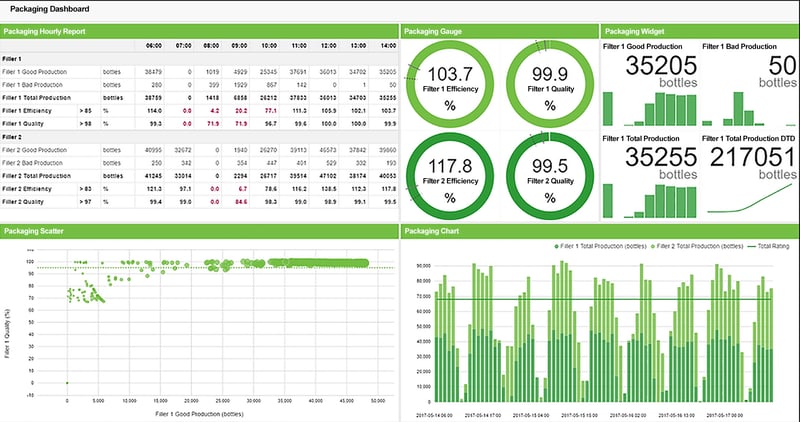
Clear Data Visualization
We’ve collected our data, we know it’s accurate, and we’ve made some calculations to manipulate our data in a way that we see fit. All the pieces are there, and now it’s just a matter of running some reports to visualize our data and make everything look nice. Flow does so in a swift and easily accessible manner.
• Quick access to reports and forms.
To accomplish this, Flow supports live reports. These live reports can be accessed via web browser, and once the report is pulled, it populates almost instantly. Gone are the days when you would import your data as keys, using redundant and cumbersome “@” symbols.
Flow is continuously updating, meaning that these reports are live and can quickly retrieve and load new information. Flow can also actively push these reports out to users via email, SMS, or even via the Flow mobile app. There is also easy user management within Flow.
• Fast and easy development.
Flow’s report designer is a breeze to use, giving you the advantage of dragging and dropping any components and measurements desired. Different levels of access to reports can be addressed as well for users.
Enterprise-Friendly Architecture
Let’s say you’ve set up some Flow instances. Maybe some of those instances perform a hefty load of work and you want to reuse it within other platforms. Flow has scalable architecture, meaning all the work you’ve put into customizing settings for instances can be used again effortlessly. Below are some different ways you can connect your data with Flow.
• Push Flow information to other data consumers.
You can push your data and any aggregations created within Flow out to different data consumers like Ignition applications through SQL view, Power BI, and other Flow platforms. It makes life a lot easier when you don’t have to go through the process of setting up an instance all over again.
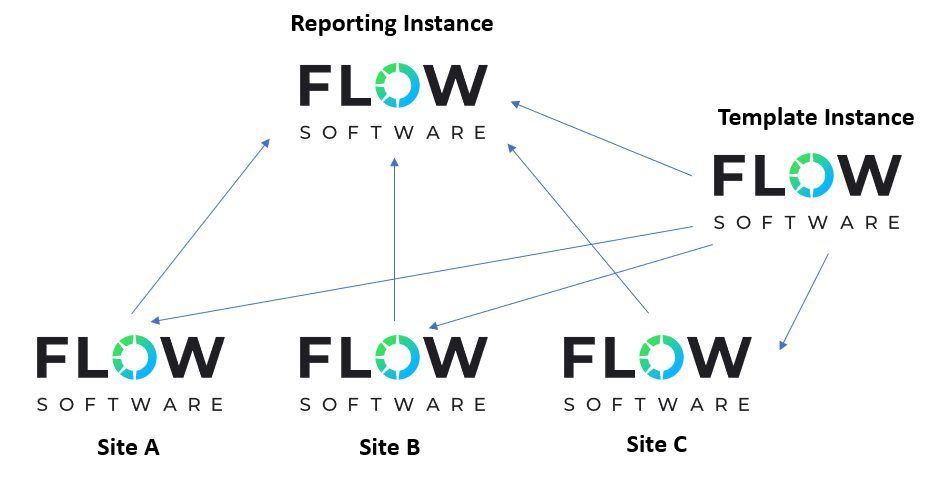
• Work smarter with templates.
You can create templates of measurements, events, and calculations using the Flow configuration tool. This really comes in handy when you have multiple sites that push data to a central reporting hub. For reporting, each site only needs to map its data sources to a defined template. The engineers can then standardize the calculations to create enterprise-level KPIs and reports.
With this method, you can trust that KPI measurements are being reported identically across your organization. And, if you ever need to change how measurements are defined, you can just develop a change within that template instance and then push it out to the other sites.
Key Elements that Make Up a Flow Instance
Below are some essential components of a Flow instance you may find yourself frequently using.
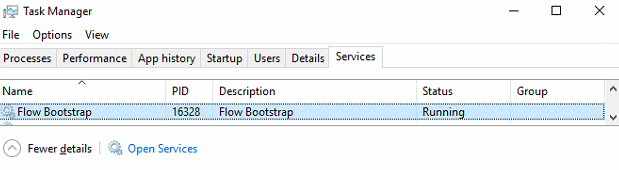
1. Bootstrap Service
When Flow is first installed, it comes with Flow Bootstrap. This is a Windows service that handles the communication between the parts in Flow and the instances that are used for reporting. Flow Bootstrap should be installed on all your client workstations to ensure a smooth experience.
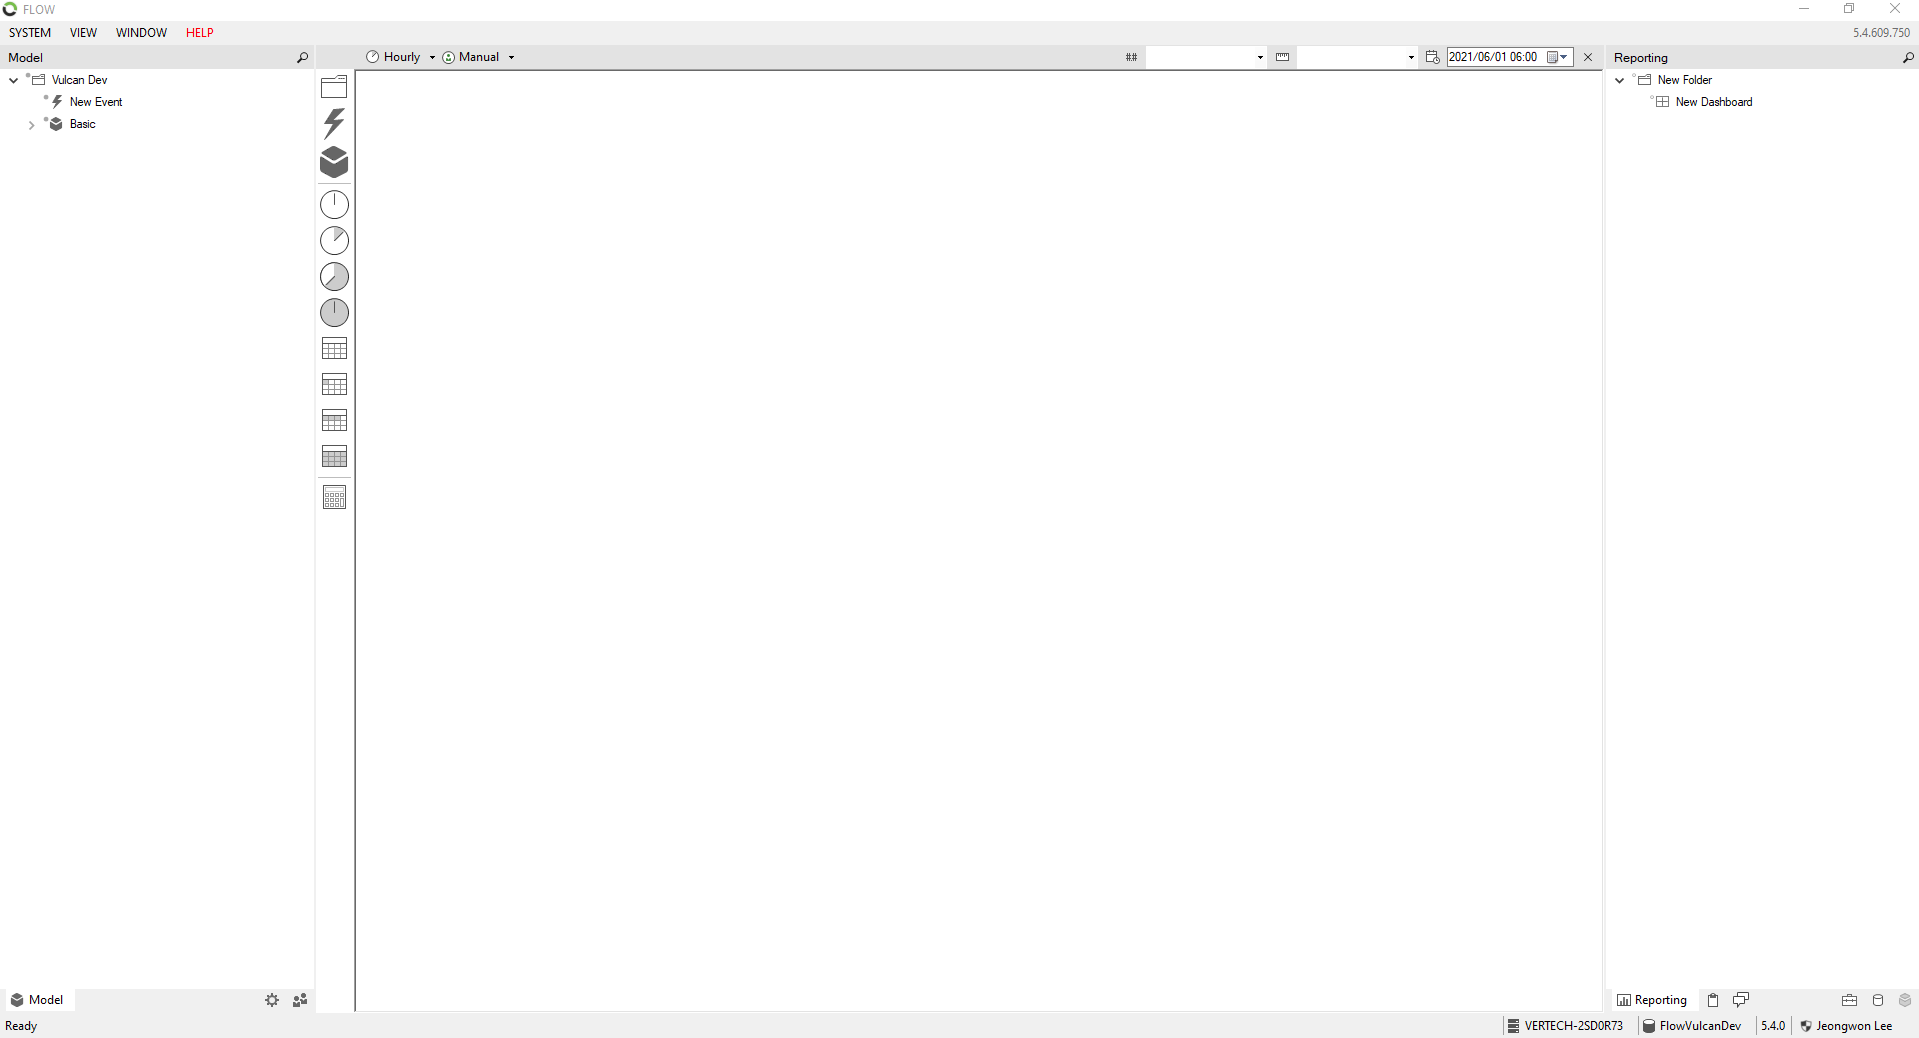
2. Configuration Tool
The configuration tool acts like a hybrid between the Ignition Gateway and Designer. This is the tool that you’ll use to manage the whole instance. You can also define measurements, organize users, design reports, and see your data source connections when using this tool.
3. Reports and Forms
Reports and forms are used for data visualization. These are what users will mainly be interacting with, and as such, are designed to display all the information you need with easy access. Flow’s reports and forms are housed in a web application that can be reached by typing in the IP address of the server of your Flow instance.
Incorporating Flow into Your Projects
Using a new software can be a learning curve, but in this case, the payoff is worth it. Hopefully, this blog gave you a good intro to Flow and some of its key benefits. If you need help integrating Flow, feel free to reach out to our top-notch industrial automation team.


Comments