
Ignition allows users to create various alarm pipelines so that they can be notified whenever a tag triggers an alarm condition. Managing these alarm pipelines is crucial for timely notification. However, when alarm pipelines do not perform as expected, troubleshooting can be challenging. Here are a few tips and tricks I have gathered from my experiences to help you troubleshoot Ignition alarm pipelines like a pro.
Status Check
As always, the Gateway logger serves as a useful tool when troubleshooting issues and providing information about errors. If there is an issue with the execution of an alarm pipeline, you can navigate to the Gateway logger (Gateway > Status > Diagnostics > Logs) to see if you can gather any information.
Alarm Pipelines Status on the Gateway webpage (Gateway > Status> Systems > Alarm Pipelines) can also serve as a resource for troubleshooting. This page shows a list of all configured pipelines along with their statuses and the number of alarms that are currently in those pipelines.
One important thing to note here is that the system evaluates alarm status at the beginning of each pipeline block. This means that when an active alarm enters a 30-second pipeline delay block and subsequently becomes inactive, the alarm will not immediately leave the pipeline. Instead, it will remain in the pipeline until the end of the delay block, get re-evaluated at the beginning of the next pipeline block, and then exit the pipeline. Therefore, the status and the number of items of the pipelines might not always match the number of active alarms.
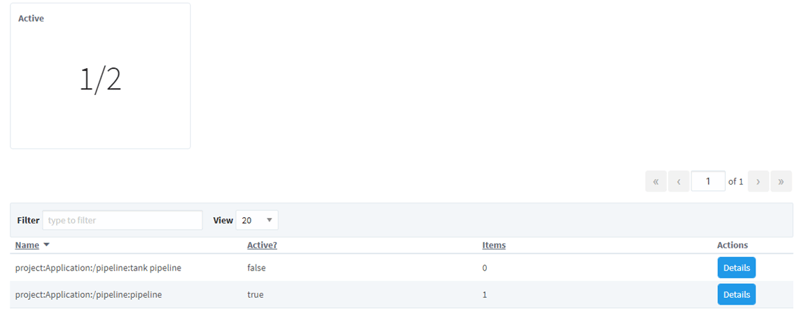
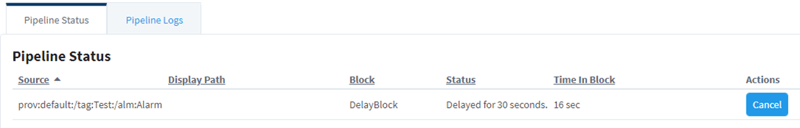
If you click on the Details button, the system will display the specific block within the pipeline where each alarm is currently positioned. Again, it is important to note that this page might show currently inactive alarms that were active when they entered the current pipeline block.
Troubleshooting with Script Block
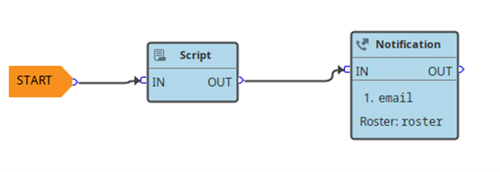
To gain further insight into the pipeline’s progress, you can incorporate a script block between pipeline blocks and print logger messages to the Gateway logger.
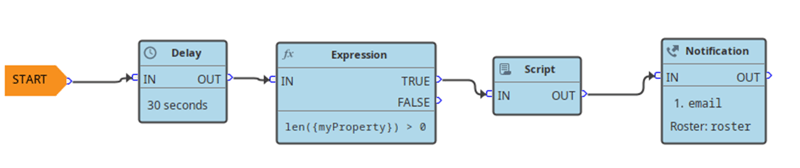
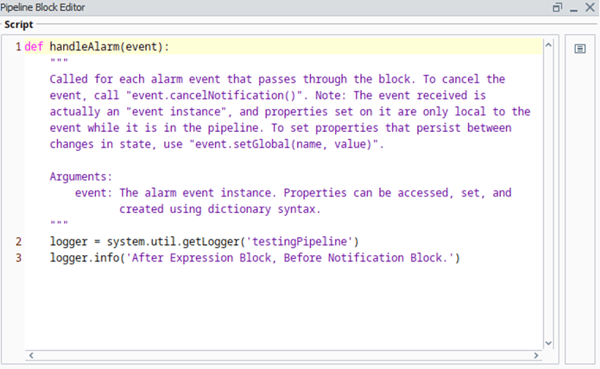
In the above example, I noticed that my pipeline was not sending out email notifications. In order to figure out the place at which the pipeline was erroring out, I put a script block in between blocks I suspected were problematic. When I did not see the logger message in the Gateway logger, I realized the expression block had not been set up properly.
You may encounter a situation where you want to check if the alarm properties in the Associated Data are being evaluated correctly in the pipeline. As a first step, you can start by logging them in a script block by using event[‘yourAssociatedDataPointHere’].
![]()
Dynamic Delay
Since the Delay pipeline block only allows for the configuration of static values, it makes it challenging to accommodate alarms with different delay duration values within the same pipeline.
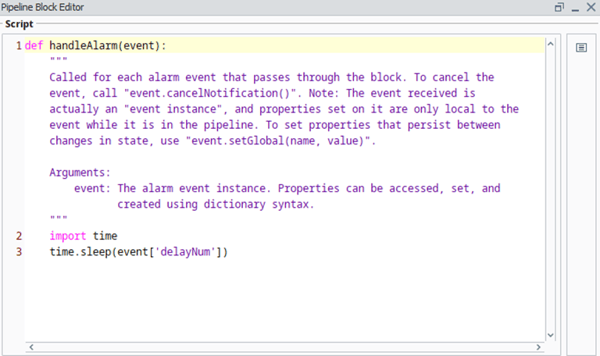
As a workaround, some may try to use a Script block to fetch a user-configured alarm property that contains the delay duration for that specific alarm. Then, they use time.sleep() to mimic the delay behavior within the pipeline. However, the use of time.sleep() blocks the pipeline thread and affects the progression of other alarms within the system. As a result, users may experience delays in receiving critical alarm notifications.
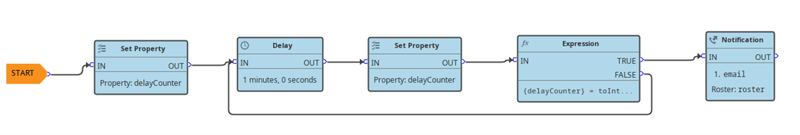
As a solution, you can try creating a delay cycle within the pipeline before it gets to the notification block. An example of this is shown below. First, a counter variable needs to be declared in a Set Property block. Then, the duration of a static Delay block should be determined based on the different delay duration values of the alarms in your system. In the example below, all alarms in the system will be set with increments of 1 minute, so the static Delay block is set to 1 minute. The counter variable needs to be incremented whenever it passes the Delay block. Finally, the counter value should be evaluated to see if it met the number of delay cycles the alarm has to go through.
A well-maintained alarm pipeline is essential to promptly address critical alarms. By checking pipeline statuses, incorporating script blocks, and implementing dynamic delay cycles, you can enhance the reliability and efficiency of your alarm pipelines in Ignition. Armed with these tips, you'll be better equipped to navigate the complexities of alarm management and maintain a smoother operational workflow.


Comments