
In my last post, I gave tips on the various tools available for finding and logging issues both within your application and with Inductive Automation’s Ignition SCADA software. In this post, we’ll dive into three additional debugging and diagnostics tools in Ignition: Execution, Threads, and Gateway scripts.
The first two debugging tools are found in the diagnostics section on the status page within Ignition.
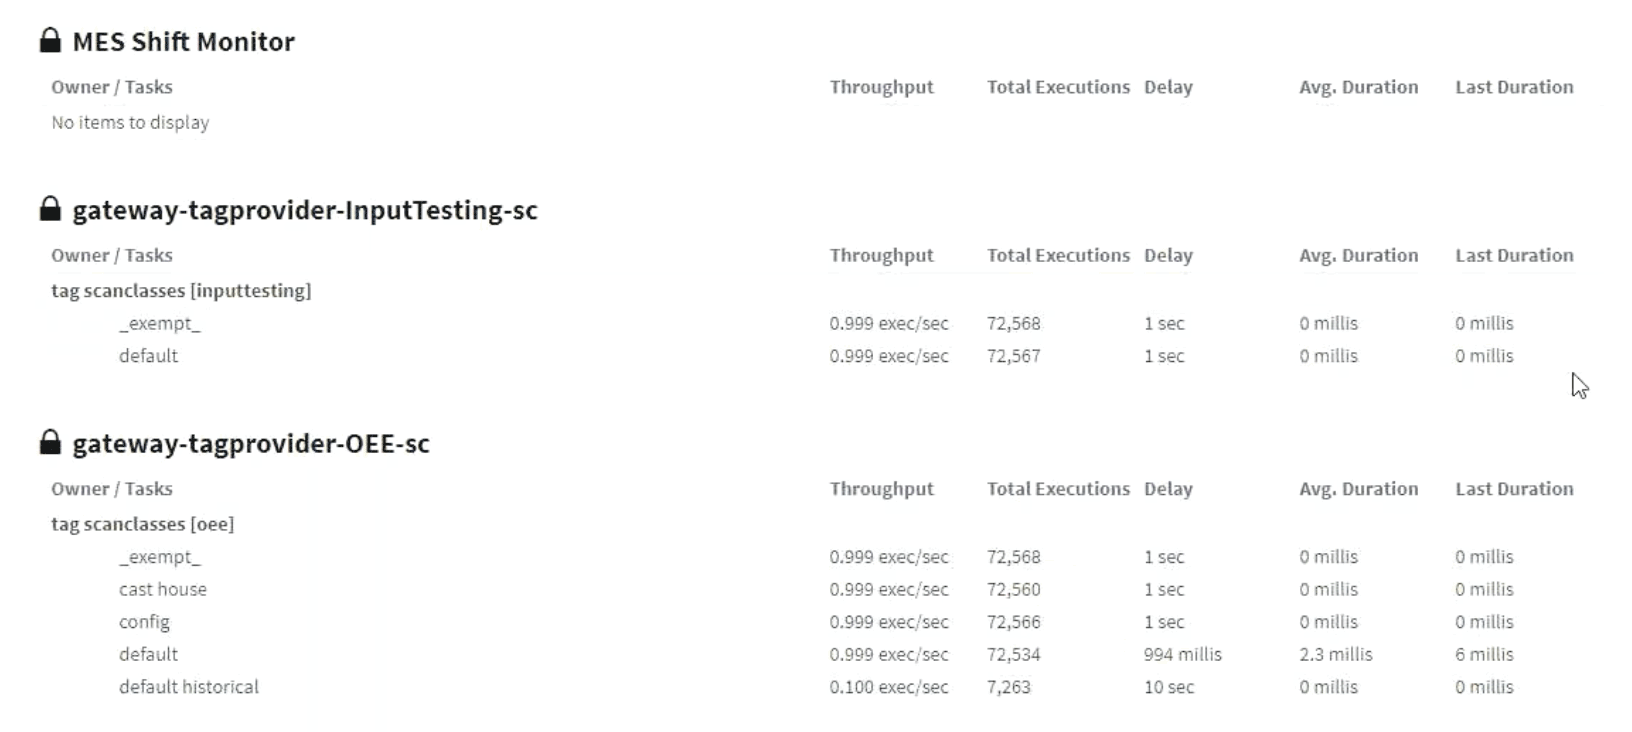
1. Execution
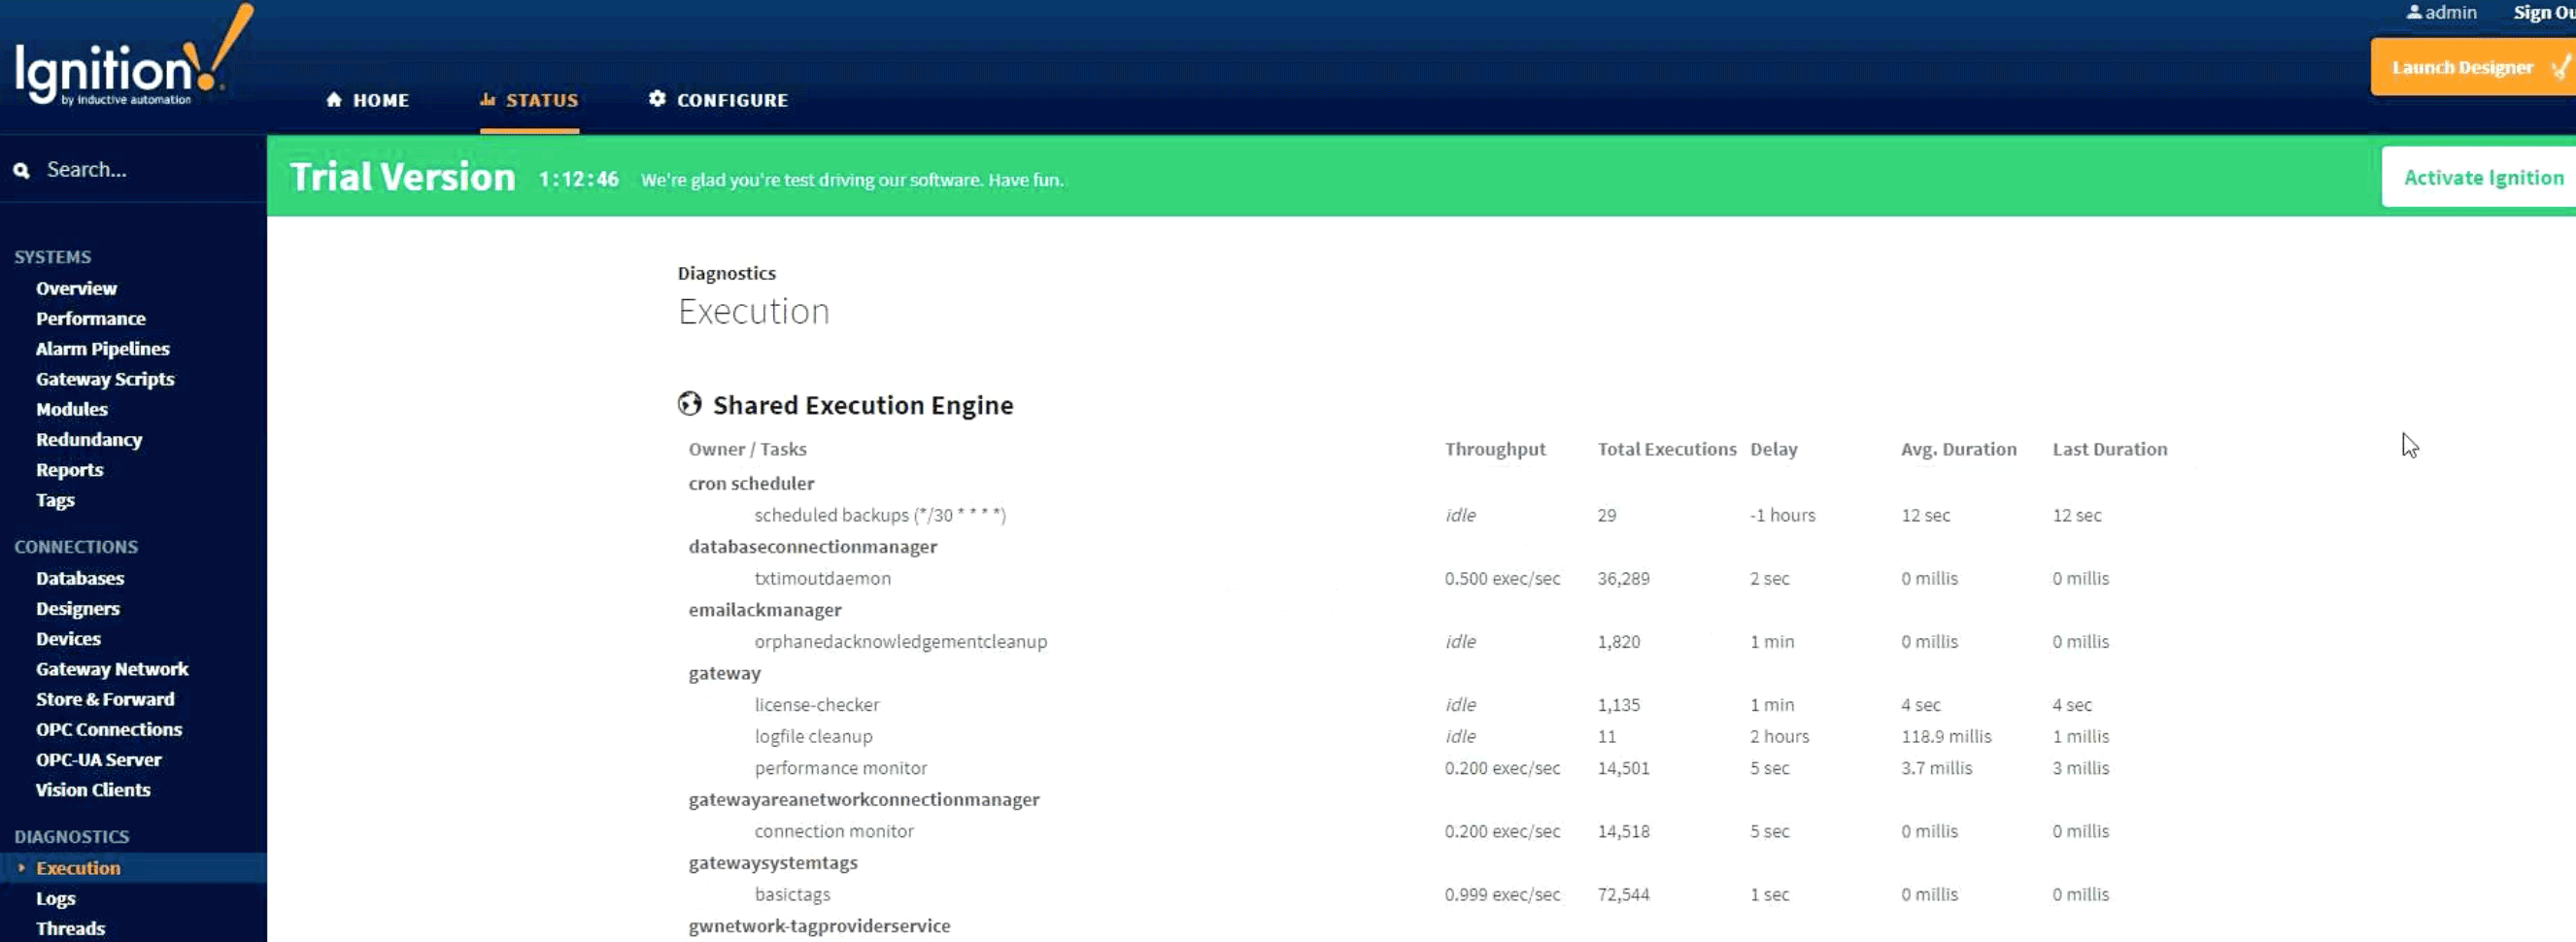
Execution shows how many times recurring tasks have executed, their average duration, the last duration, and the time between executions. This is where you can pinpoint problem areas with tags. For example, if your tags are unresponsive and are not updating as expected or you are getting an unknown quality, you can go to Execution and check the metrics on those tags’ scan classes. You may see that a particular scan class is overloaded for its execution rate and it’s executing faster than it can finish. In this case, you can either increase the scan class scan rate or move some tags to a different scan class.
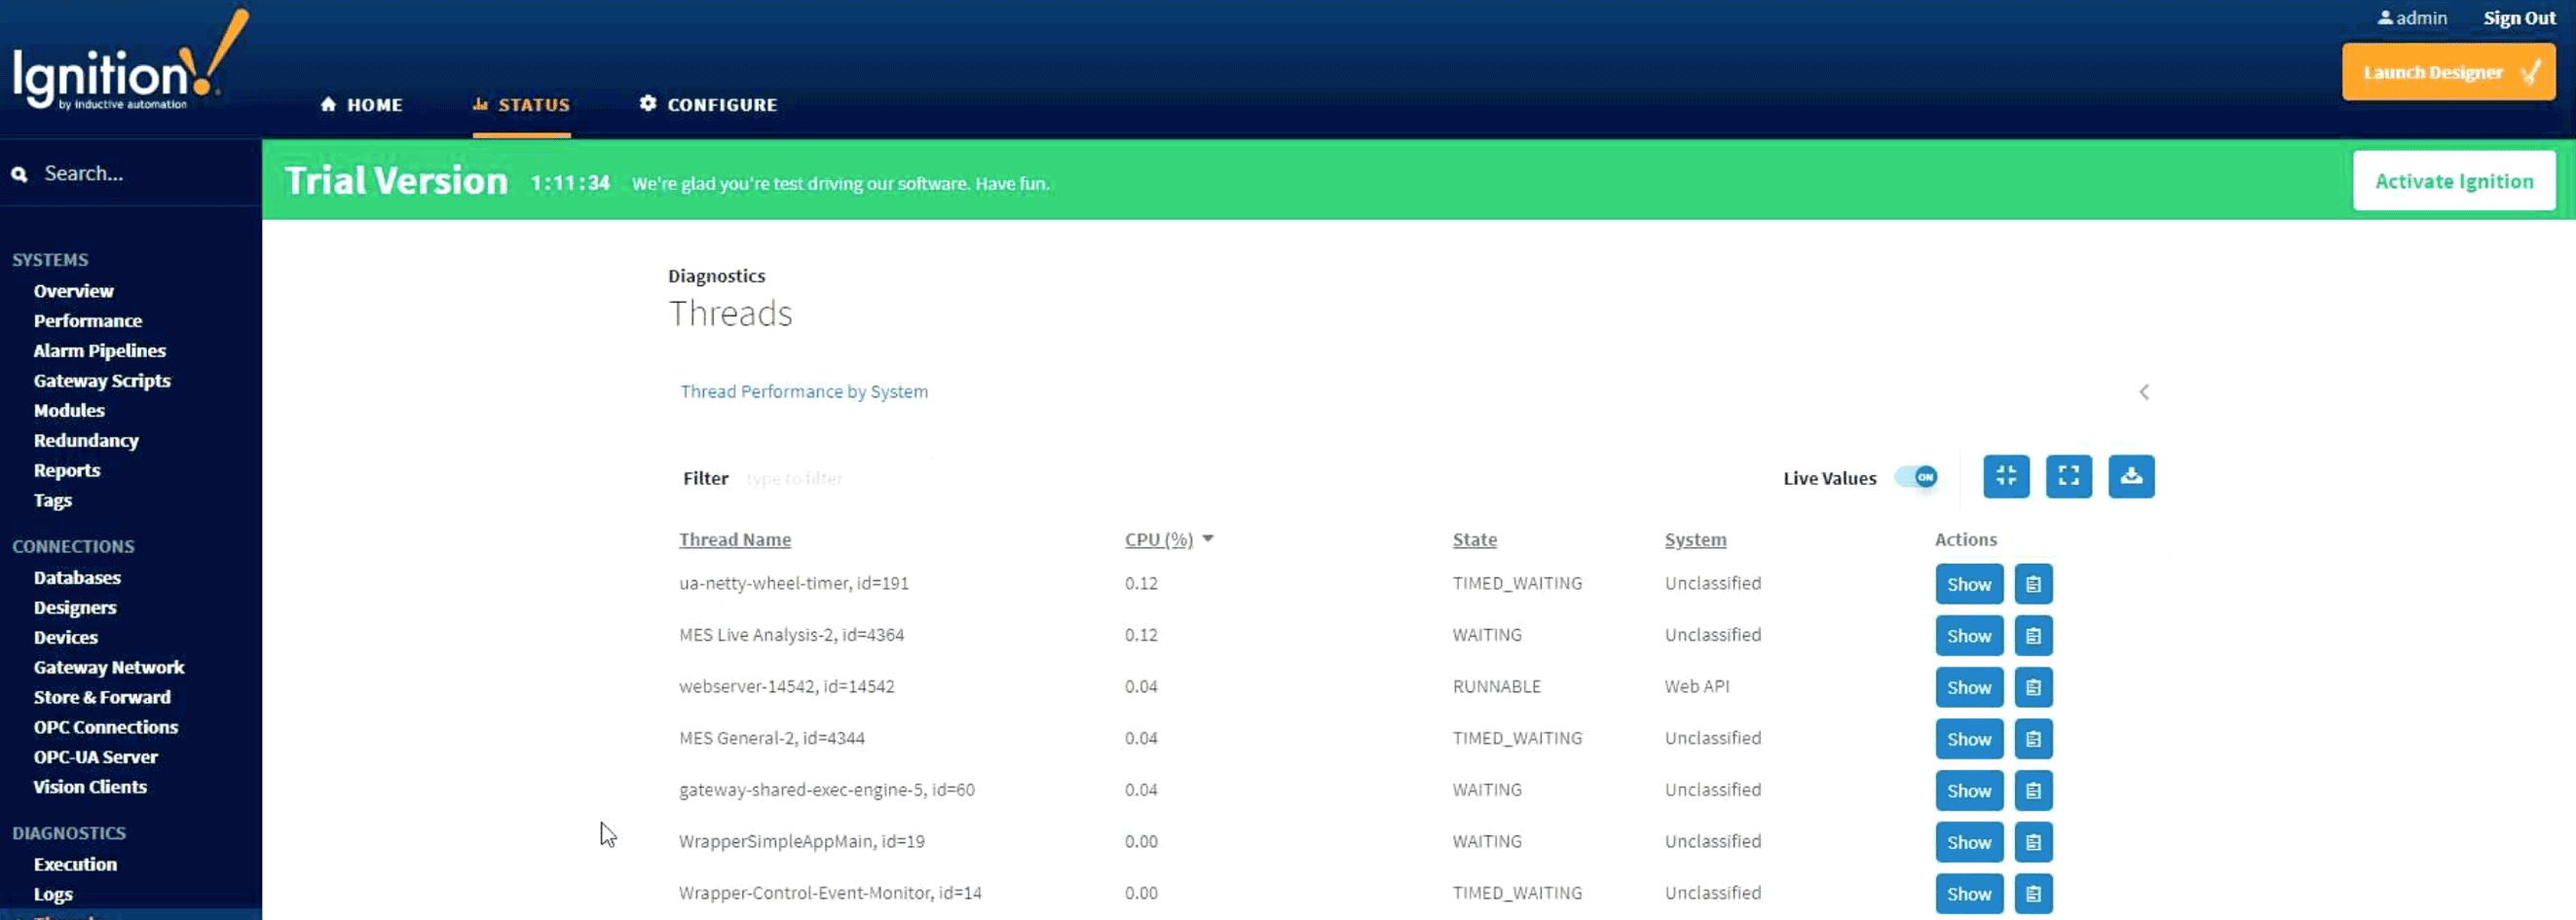
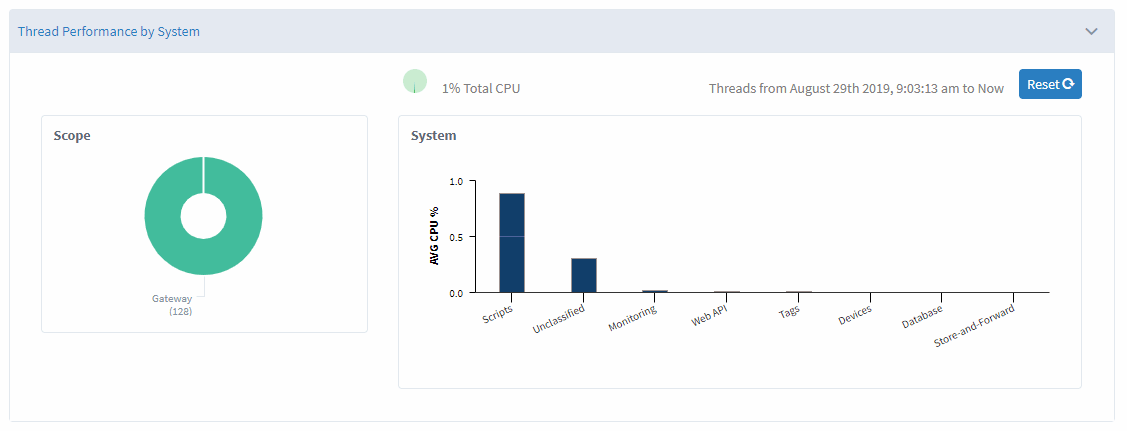
2. Threads
If your system has become sluggish, a good place to look in Ignition is in Threads. This page shows all threads that are running in Ignition – mostly automatically-created system threads. Any time you add a new Gateway script running on its own thread, it’ll show up here. This tool shows CPU usage per thread and a breakdown of what systems are using the most resources such as scripts or database access. As an example, if your system performance has dropped recently, you can check the threads to see if there are any issues with stuck scripts using a lot of CPU trying to recover. In this case, a Gateway restart should solve the problem.
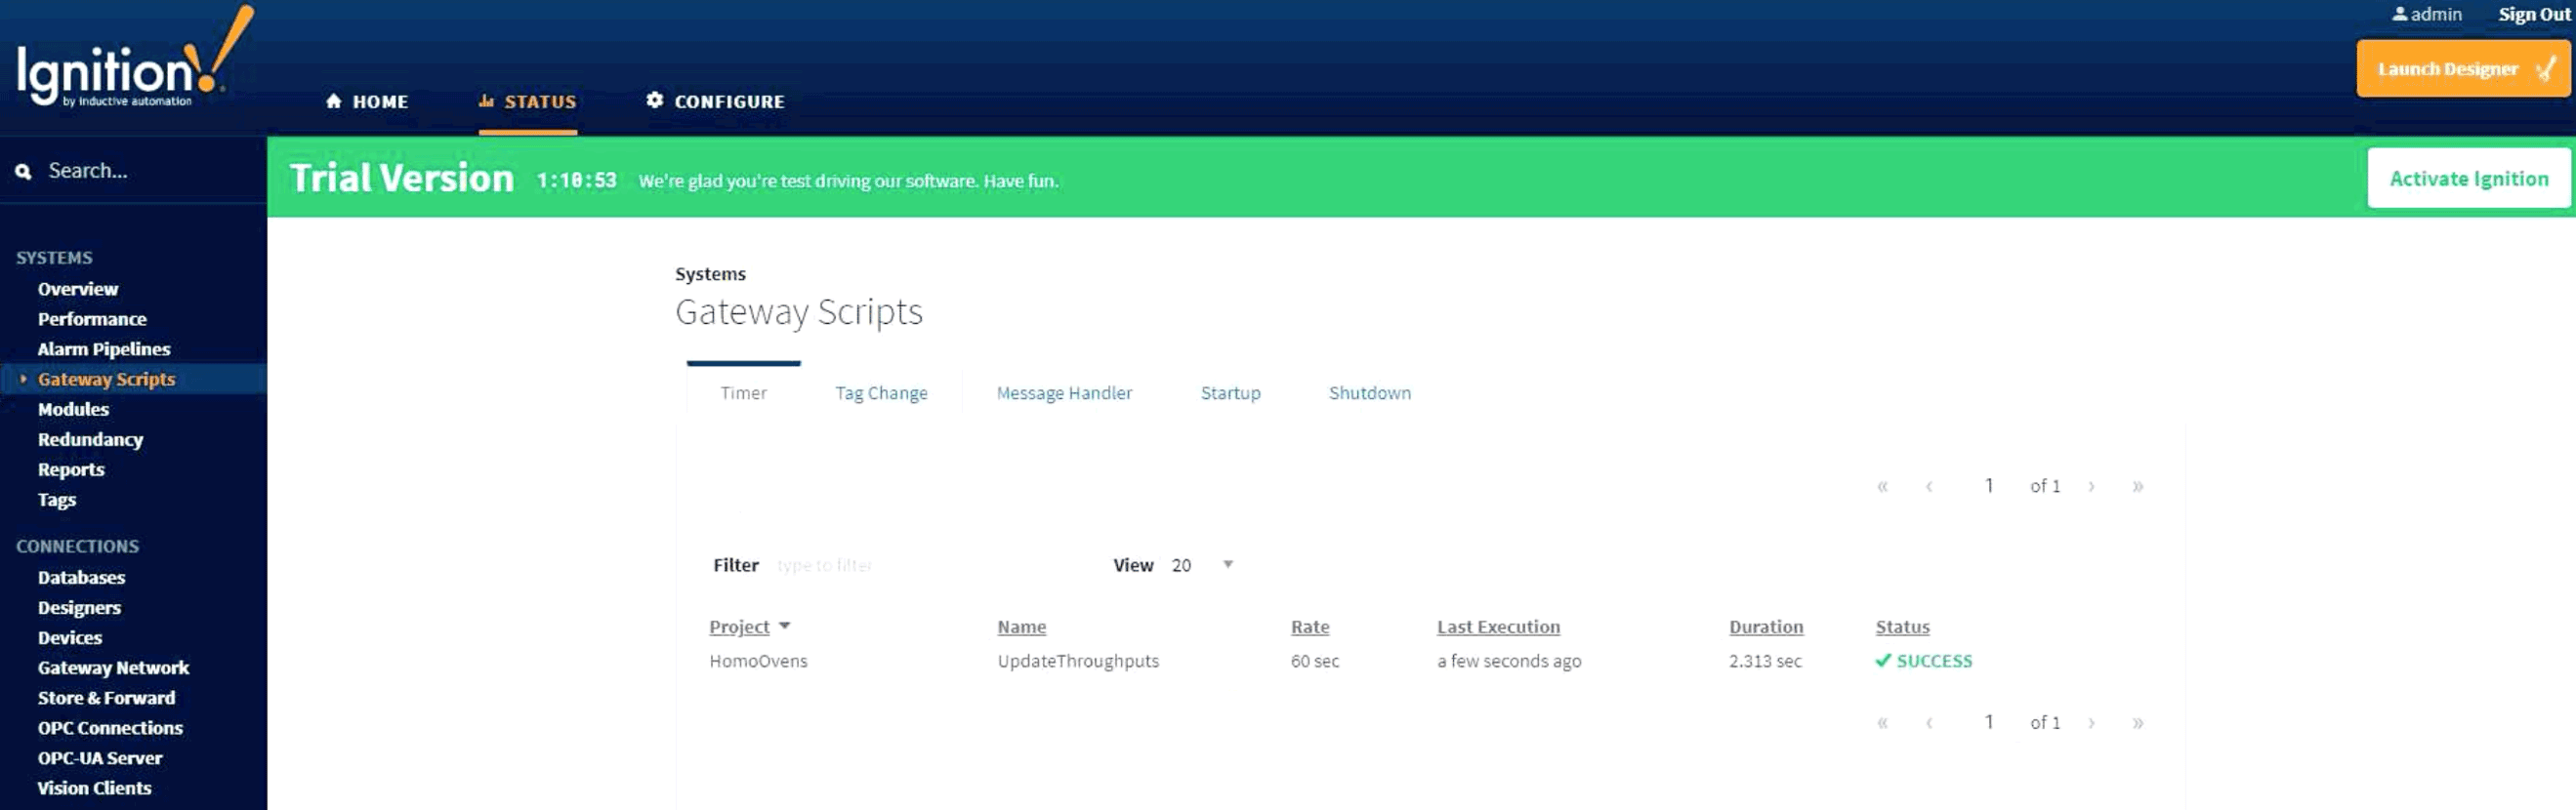
3. Gateway Scripts
Another place within Ignition to locate errors is in Gateway Scripts. If you have a timer script, Gateway tag change script, or message handlers, this is where all the logs will be printed, showing last execution, duration, and status. The status column will notify you if there is an error with the script or if it is executing too slowly.
Now that we have covered places to catch bugs in Ignition, our final blog in this series will cover error handling and mitigation techniques.
Learn more tips and tricks for using Ignition
- 5 Tips to Improve Ignition SCADA Performance
- Using MQTT with Ignition SCADA
- Web Development in Ignition SCADA
- Tips for Using Python in Ignition SCADA


Comments