
Inductive Automation’s Ignition platform is a powerful, flexible, and highly customizable SCADA platform enabling data-driven decision making for industrial enterprises. Before the final product hits the plant floor, however, developers must configure and program the platform. This post provides a few tips on the different tools available for troubleshooting issues both within your application and with the Ignition software.
Ignition Debugging Tips
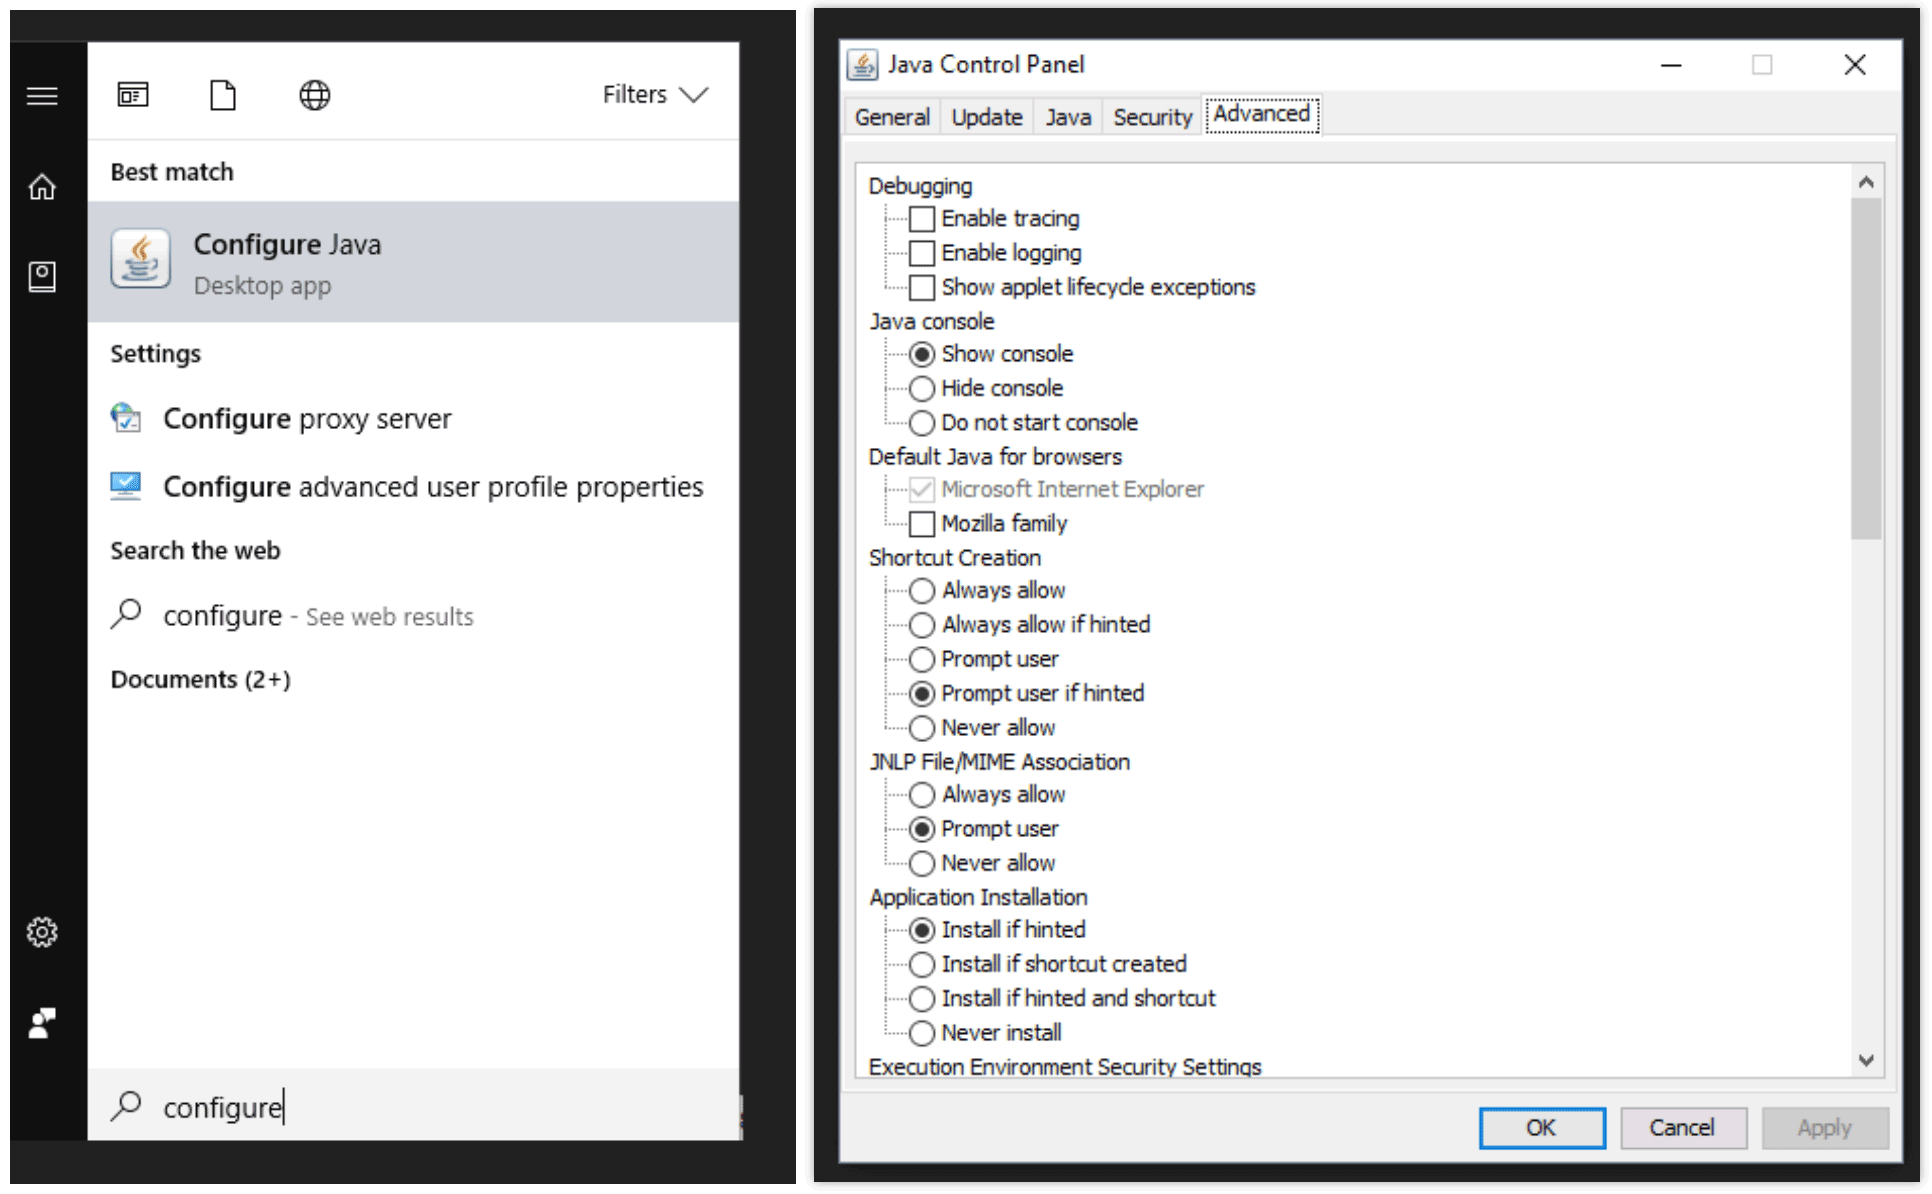
A good starting place for debugging Ignition issues themselves is the Java Console. Because Ignition is built on Java, if problems arise with Ignition – for example, if the Ignition Designer fails to launch – the Java Console is a good place to check for answers. By default, the Java Console is not enabled, so you’ll first need to go in to the Java settings and enable it. Once enabled, the Java console will launch with every client and designer instance opened and will display Java-related messages.
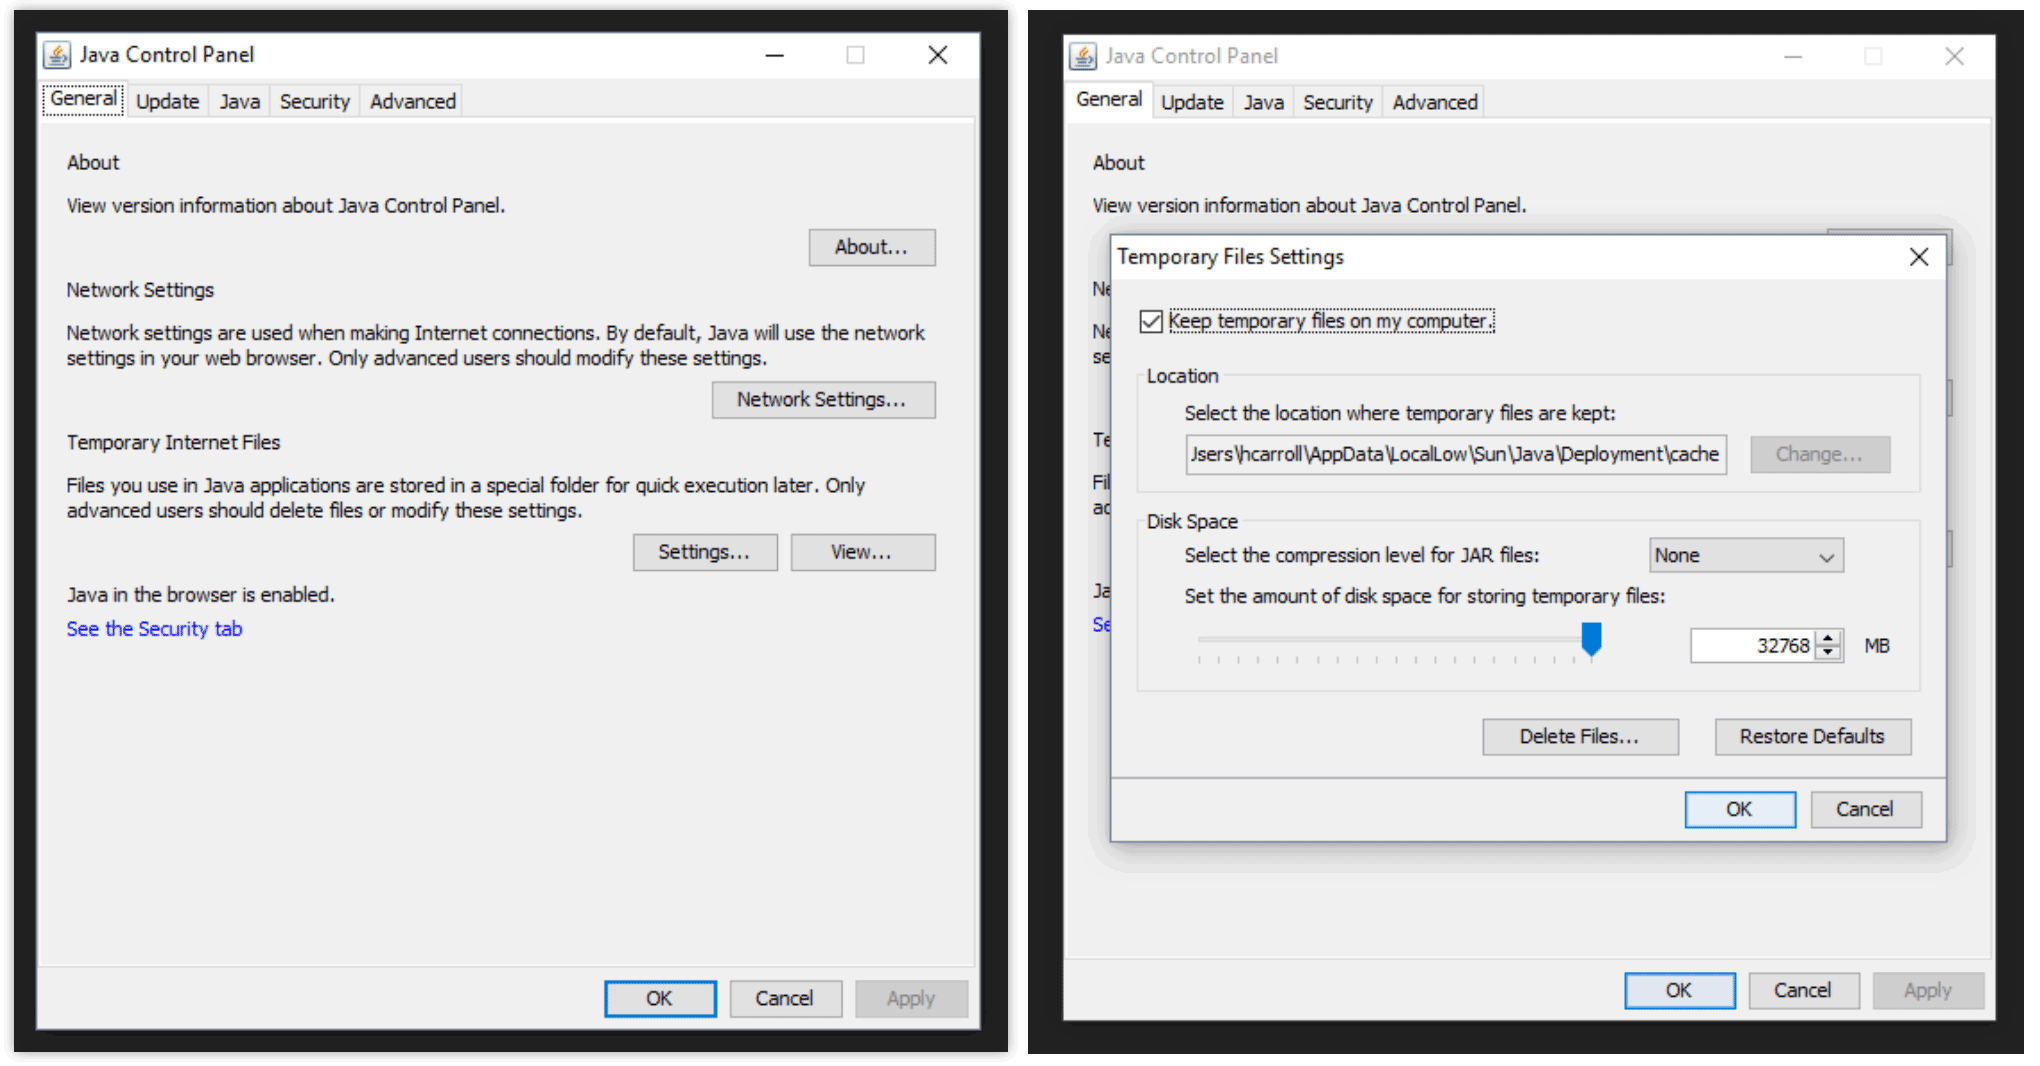
Another thing to try within the Java settings is clearing the cache, especially if problems have started that haven’t happened before. To clear out the Java cache, go to Java Control Panel, select Settings under Temporary Internet Files, and then click the Delete Files button.
If Java isn’t causing the problem, here are some ways to help you troubleshoot your issue.
1. Ignition Logger
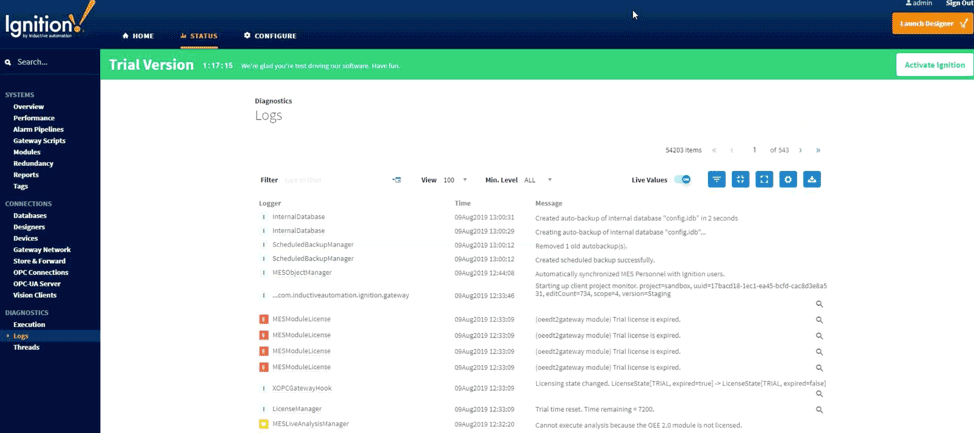
If you navigate to the Ignition Logger by going to Status > Diagnostics > Logs, you will see all the logged messages that are coming from Ignition modules. You can send your own custom messages here with their own priority level from trace all the way to fatal. However, only Gateway-scope scripts and events will be sent here. This includes scripts like a Gateway Timer script or a script on a Tag Change event. Client-scoped events will not be sent to the logger, these instead will be sent to the diagnostic tool in the client.
2. Print Function
The print function in Python scripts is the most common method for finding and logging bugs. If you use the print function in the Ignition Designer, print statements can be viewed with the Output Console. When debugging from a client, the Diagnostics tool in the client will display the print statements in the Console tab. If the Help menu item is not visible, the Control+Shift+F7 hotkey combination will open it up. Only client-scoped scripts will be visible from either the Output Console or the client Diagnostic Console. Examples of client-scoped scripts are Client Startup scripts and user events such as a button press.
3. Audit Log
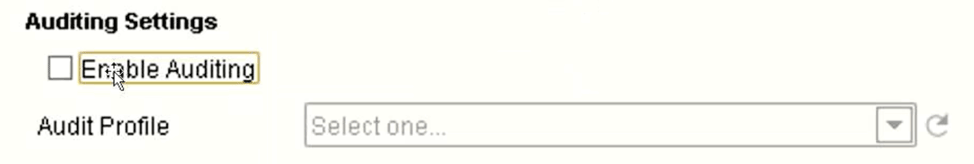
If errors are coming from unexpected issues such as missing tags or incorrect data, another handy tool is the Audit Log. The Audit Log needs to be set up on the Gateway web page by navigating to Configure > Security > Auditing. You will also need to check “enable auditing” in the Project Properties and select your profile for the audit log to record. The Audit Log will automatically log write operations such as tag writes and SQL updates, inserts, or deletes.
Because this tool logs includes timestamps, users, and events, it’s helpful in identifying how a tag got deleted or why it’s not functioning in the way you expect. You also can manually write to the audit log to track events.
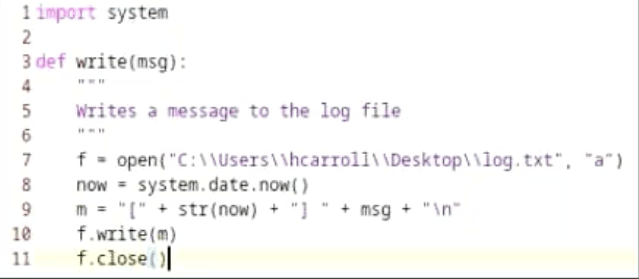
4. DIY
The DIY method is extremely simple and is the method that I prefer to use in development because I can ensure everything will be logged to one central location. It can be set up with a few lines of code to use basic Python functionality to create a text file and append it every time a message is logged. This is a useful approach because it will write from anywhere: if you put it on a button, it’ll write to the file. If you put it on a tag change, it’ll write to the same file. The downside is that it will only log information you specifically tell it to.
You can use the code below for a very basic log file. For a more sophisticated system, you can add code to split files into specific time frames such as monthly or daily and delete old log files when they become outdated.
Knowing where to find the errors is just the first step. In our next blog in this series, we’ll discuss how to handle errors once you’ve identified them.


Comments