
Back in 1834, Samuel Taylor wrote a poem titled “The Rime of the Ancient Mariner” that is still famous in part for its line “water, water everywhere, nor any drop to drink.” Much like those ill-fated mariners, our manufacturing enterprises accumulate ever larger oceans of data, but we struggle to squeeze a drop of information from them. Data analytics to the rescue! From looking at what happened in the past to predicting what might occur in the future, knowing how to effectively apply big data analytics techniques on your plant floor can provide numerous time, cost, and resource saving benefits.
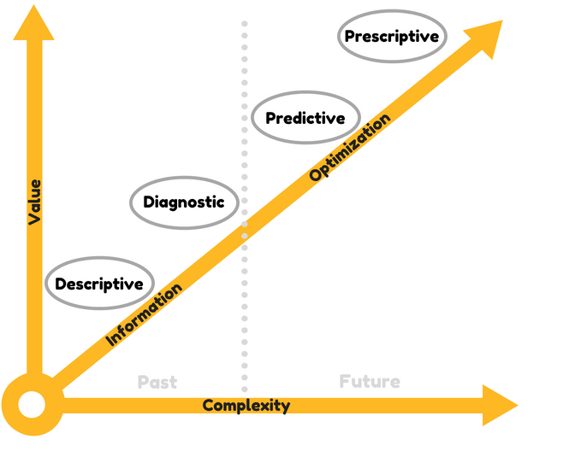
Through each of the four main pillars of data analytics, plant managers and operators can more easily address the following key questions:
1. Descriptive analytics – What has happened?
2. Diagnostic analytics – Why did it happen?
3. Predictive analytics – What is likely to happen?
4. Prescriptive analytics – How can we make it happen and what are the consequences?
Methods used under each of the four pillars of data analytics can provide valuable information for both plant managers and operators.
Let’s take a closer look at how techniques falling under each of these four pillars can be applied on the plant floor to extrapolate and interpret valuable data.
Descriptive Data Analytics
At a high level, descriptive analytics is a fairly easy way to get interesting and real data out of your system to see how your processes are doing. At Vertech, we’ve been using descriptive data analytics methods in the systems we design for many years. For example, we look at time series data using trend tools that can show us what happened in the process. Using this technique, operators can visually analyze information by looking for event sequencing and process values that can reveal areas for process optimization or root cause analysis of failures. While many plant operators and managers don’t really think of this as analytics, trend tools are actually analytics in their most basic form.
Additional descriptive data analytics tools that are fairly easy to implement, yet can bring tremendous value to your operations, include:
- Performing real-time descriptive/statistical analysis of production monitoring
- Performing periodic assessments and producing reports of facility operations data via various statistical analyses and aggregations
Diagnostic Data Analytics
Like descriptive data analytics, diagnostic tools are also used to look at and analyze what happened in the past. Diagnostic tools are slightly more complex in that they are used for more automated analysis rather than requiring an operator’s input. Diagnostic tools also provide analytics of what trends mean as well as information on what happened and how to possibly correct issues.
Ways to use diagnostic data analysis include the following:
- Alarm Management – Using a cluster of alarms in an alarm roll-up system based on appearances to find out what alarm likely set off an alarm cascade
- Quality Assurance – Identifying a fault related to a loss in quality and assessing its point of origin
- Failure Analysis – On failure of a process or machine, examining what could have happened to cause it
Predictive Data Analytics
Predictive data analytics involves predicting what will happen in the future based on the data available now. Unlike diagnostic or descriptive techniques, predictive data analytics is a forward-looking tool; therefore, it involves more complex technology and analytics techniques.
For example, predictive data analytics can use lessons learned from historical information combined with new data from the plant floor. This can be done using methods such as regression and outlier analysis to make predictions of future system behavior. Ideally, this data gives operators a chance to proactively prevent or minimize downtime rather than simply react and diagnose.
But, predictive data analytics is not just about downtime. Predictive techniques can also be used for the following:
- Output Forecasting – The amount of output that will be generated at current rates based on known first-principles of processes and current data trends
- Supply Chain Forecasting – Demand for inputs from the supply chain
- Revenue Forecasting – How much revenue can be made or lost at current trends
Prescriptive Data Analytics
Another, more complex, forward-looking tool is prescriptive data analytics. This method combines the analytics of predictive methods with the ability to prescribe a solution that can prevent a forecasted negative outcome or facilitate a potential positive outcome. With prescriptive data analytics, a simulation of possible outcomes is usually made along with a quantification of the effect of each outcome that helps in decision-making.
Examples of prescriptive data analytics include:
- Process Optimization – Simulating your processes to see what can be tweaked to optimize each process
- Revenue Optimization – Figuring out how to maximize revenue by optimizing relevant processes
- Supply Chain Optimization – Optimizing the production, scheduling, and inventory in a supply chain
Now that we’ve covered the basics of the four pillars of data analytics, in part 2 of this two-part series we will get into more details about the tools for performing data analytics both onsite and in the Cloud.
Ready to implement data analytics into your manufacturing plant? Contact us to learn more about how data analytics can save your time and money.


Comments