


.png?width=117&height=80&name=arizona-tea-font%20(transparent%20background).png)


.webp?width=155&height=70&name=Rectangle%208%20(1).webp)


Smart Alarming
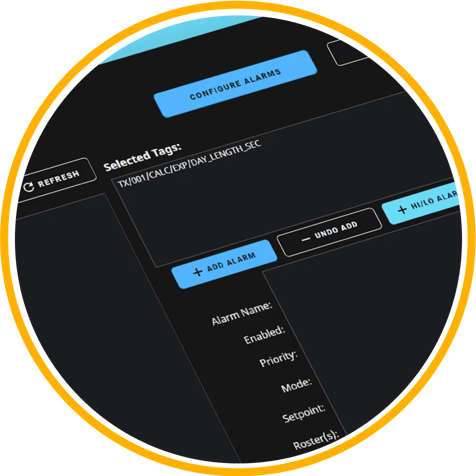
Nuisance Alarm Filtering.
We improved the alarming logic across the fleet to prioritize alarms and consolidate repeat alarms into one action.
Built-in Alarm Hierarchy and Dependencies.
This feature allows the client to add dependencies to alarms. When equipment upstream fails or shuts down, the alarms on downstream devices automatically shut off. This enables the client to identify and solve the root cause of the problem, rather than responding to hundreds of subsequent alarms.
Enterprise-Level Maps
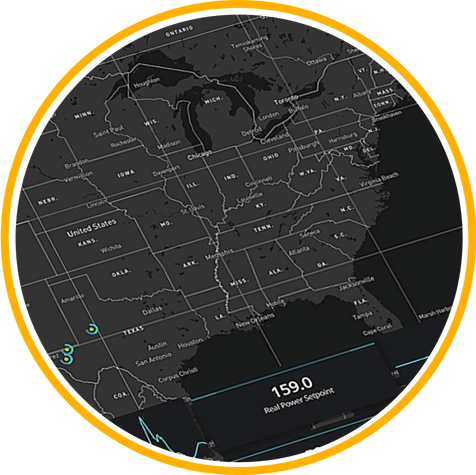 Our team designed custom maps on Mapbox and integrated them with Ignition, so they blend beautifully into the visual application theme.
KPI’s
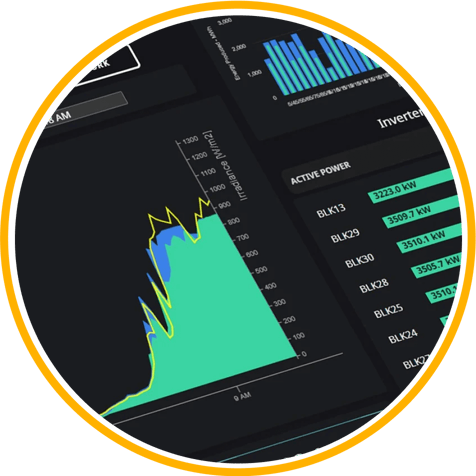
Power and Revenue
Our team collaborated with SB Energy to measure power and revenue using KPIs. By having the system display information from both business and operations in one application, decision-makers now have a clear understanding of what's happening across the entire portfolio.
Data Popups
Alongside the KPIs, trending popups allow operators and management to keep up with real-time data patterns and stay aware of site curtailments and revenue losses.
Weather Forecase Integration
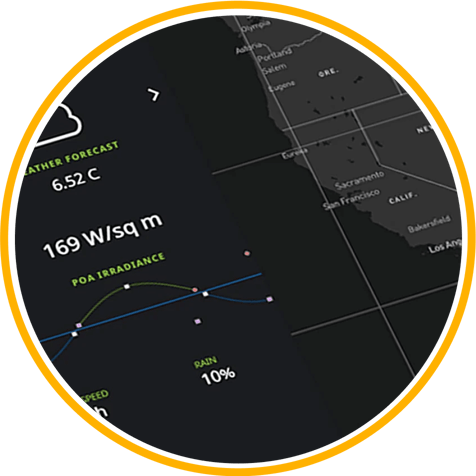 We integrated with Open Weather Maps and Windy.com to provide real-time weather updates for each site. We make real-time API calls to Open Weather Maps and Windy.com. We also leverage Windy.com's crisp map displays as needed throughout the system.


.png?width=750&height=679&name=247Support%201(1).png)