


 The MES Overview displays critical information for all core production lines during the shift. It reports equipment utilization as well as OEE, production status, work order information, and time spent for each core line. Note: Screenshot is simulated and does not represent actual process data


MES Overview
The MES Overview displays critical information for all core production lines during the shift. It reports equipment utilization as well as OEE, production status, work order information, and time spent for each core line. Note: Screenshot is simulated and does not represent actual process data.
Mill Overview
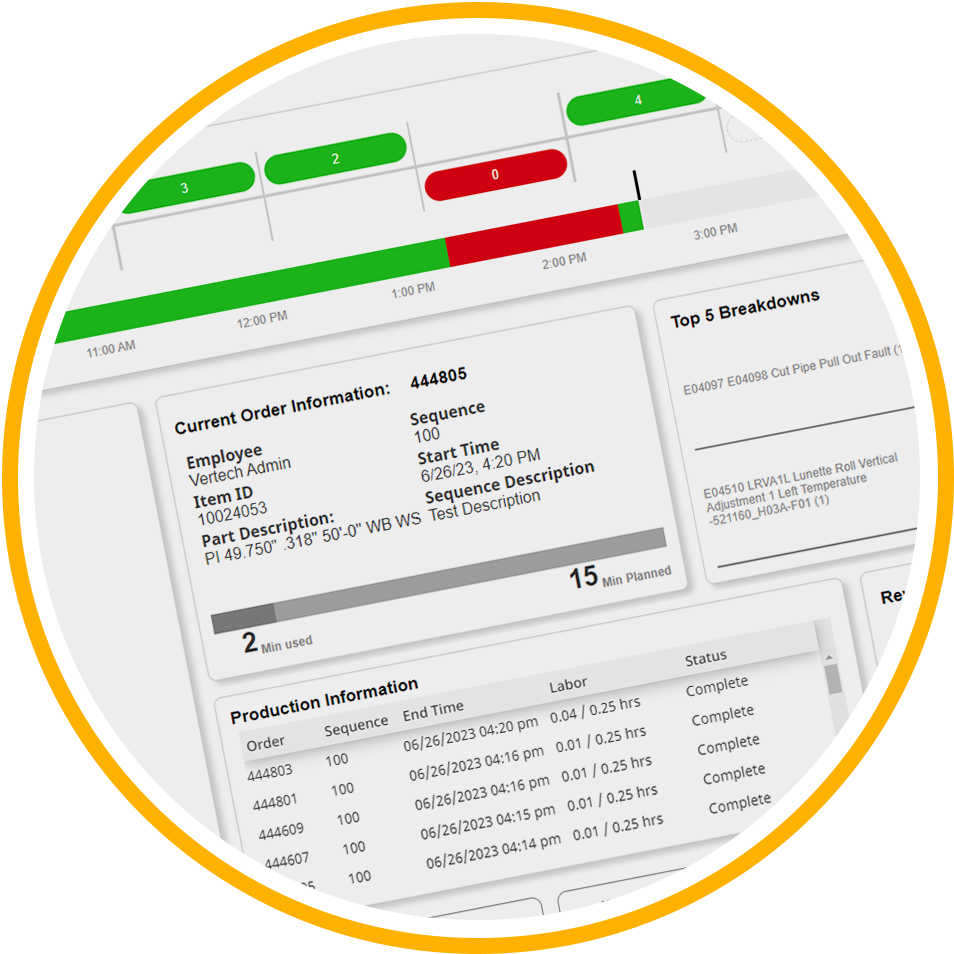 The Mill Overview gives the operator a production overview for that shift. The header displays the current line state, mode, and work order information. The Performance Tracker card shows the status and performance of the line in an hour-by-hour breakdown. The OEE Gauge on the left shows the breakdown of OEE and the contributing variable percentages: Availability, Performance, and Quality. The Current Order Information card shows the active order and operation sequence and the total active time spent on the sequence. The Production Information card shows all orders and their runtime information for the current shift. The Top 5 Breakdowns card shows the accumulated top five downtimes for the current shift and the average, minimum and maximum downtime for the specific downtime reason.
KPI’s
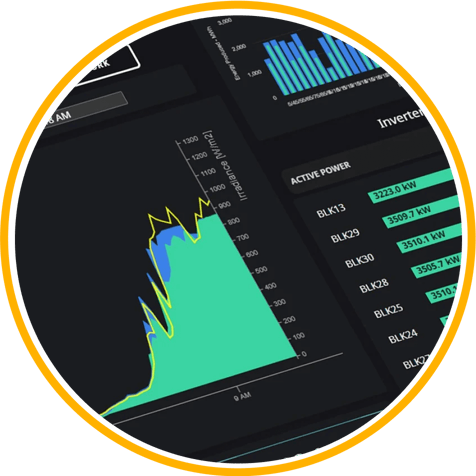
Power and Revenue
Our team collaborated with SB Energy to measure power and revenue using KPIs. By having the system display information from both business and operations in one application, decision-makers now have a clear understanding of what's happening across the entire portfolio.
Data Popups
Alongside the KPIs, trending popups allow operators and management to keep up with real-time data patterns and stay aware of site curtailments and revenue losses.
Weather Forecase Integration
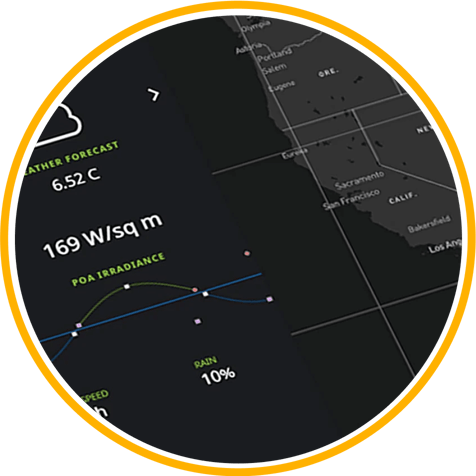 We integrated with Open Weather Maps and Windy.com to provide real-time weather updates for each site. We make real-time API calls to Open Weather Maps and Windy.com. We also leverage Windy.com's crisp map displays as needed throughout the system.

.png?width=750&height=679&name=247Support%201(1).png)