In the Beginning...
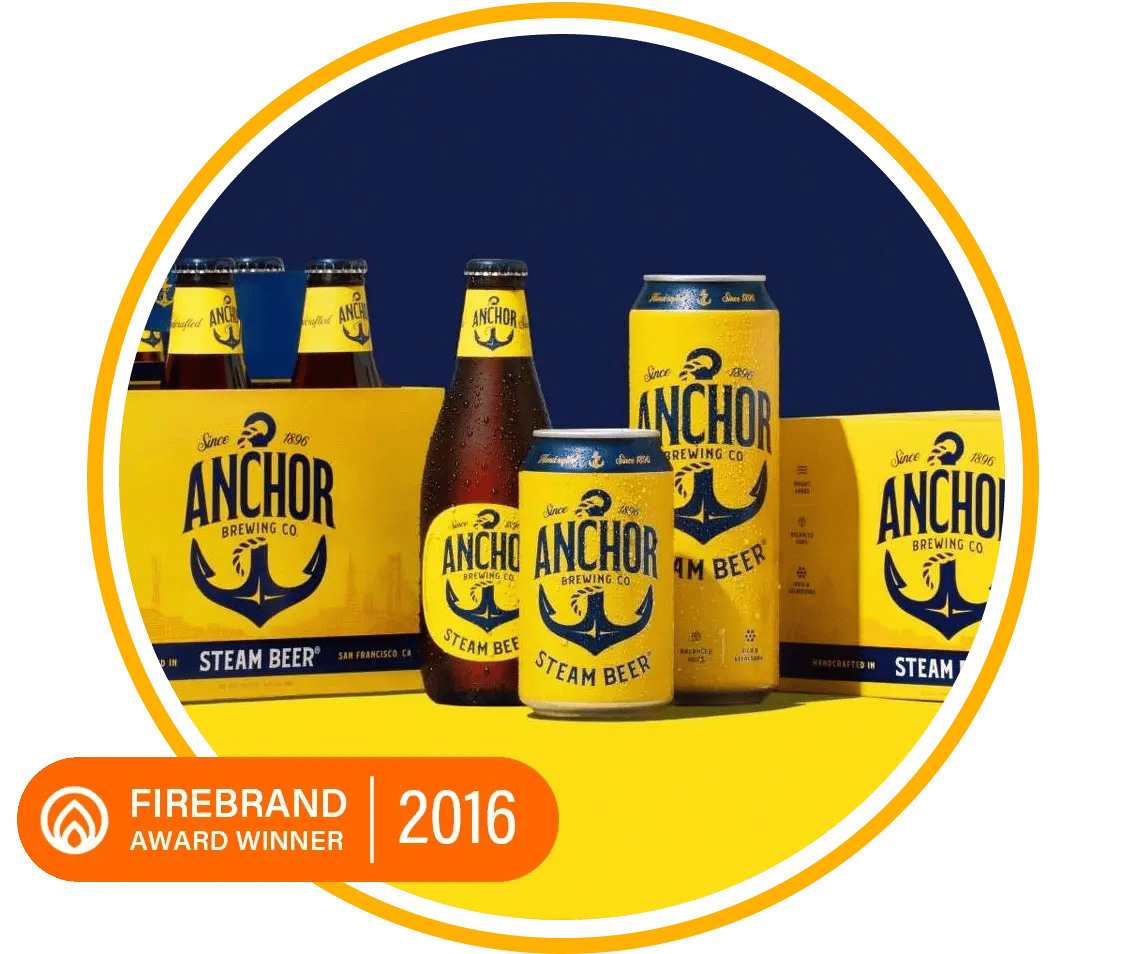
Production facilities like Anchor Brewing run at a lightning fast pace and every minute of downtime and each incidence of waste translates to a big cost. Vertech wanted to automate the gathering of production rates, waste, and downtime on a running line without interrupting production in any way on dozens of customer lines, network configurations, PLCs, meters, and brands. Vertech needed to find a way to create a compact but powerful analysis machine that only required a single power outlet and a single network connection.
White Box Requirements:
- It must install in one day without any downtime on the line.
- It must be a “Swiss army knife” type of product that can connect to any PLC, power source, line configuration, and any sensors.
- Everyone in the facility must have access to the data.
The Plot Thickens
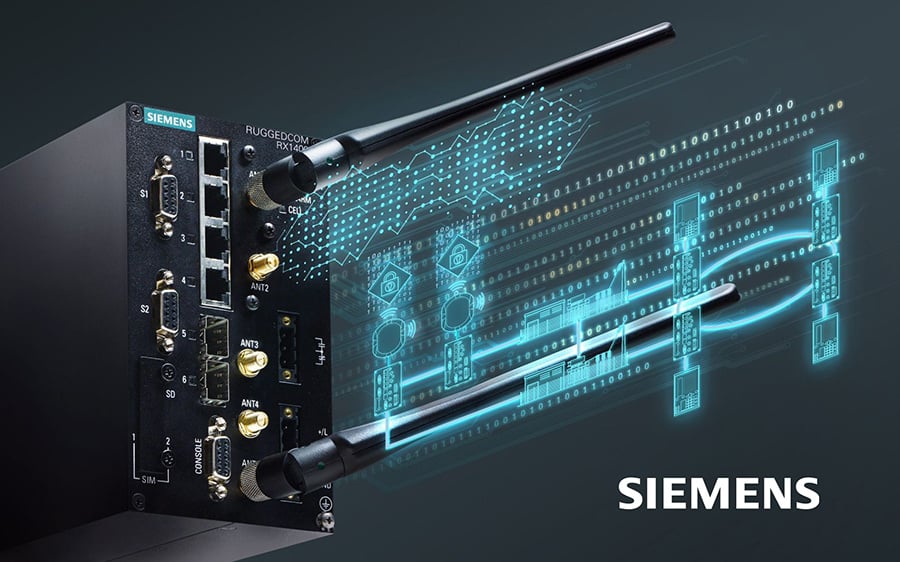
To fit such a dynamic and varied set of hardware, Vertech utilized Inductive Automation’s Ignition software, which seamlessly connected to the client’s existing control systems, including the PLCs, photo eyes, and flow meters. By supplementing an on-board Siemens PLC, including Vertech’s PLC code for dozens of instruments and scaling routines, we were able create an instant drop-in control system that sits in parallel to existing infrastructure.
The Happy Ending
The resulting system was installed in days without interrupting production, and takes less than five minutes of operator interaction per shift. It can record, analyze, and display production data with a simple, intuitive operator interface, and provides high-level cost analysis and report generation for supervisors, accessible on any device.
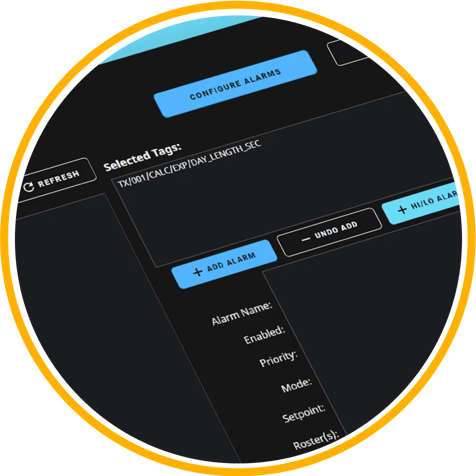
From day one, the White Box constantly gathers production data that is instantly available to view and explore. The simple configuration includes the actual products, SKUs, case configurations, line rates, financial data and specific downtime reason codes from the brewery. Operators are able to see planned production, progress, performance, downtime and expected delays. The operator screens use HMI optimization tactics to quickly communicate the most important information while not distracting people from operating the line. Supervisors, plant managers, and other executives are able to see real-time performance, run progress and top downtime reason codes.
Additionally, there are historical screens that show all production runs, charts of the best and worst runs from the perspective of OEE, and a production analysis screen. The analysis is available for any line over any time period and for a single product or all products. The screen is an easy-to-understand analysis of the labor losses, yield losses, the loss distribution by product and the improvement.
Anchor Brewing Company found enough low-hanging opportunities to have a complete ROI in 12 months. Prior to using the White Box, Anchor was certain that its line ran at 415 bpm through manual OEE tracking, and was shocked to find that on average it ran at 322 bpm and never exceeded 365 bpm. Here's to accurate, accessible, real-time data!

.jpg?width=2000&name=Frame%20299(7).jpg)
(1).jpg?width=2000&name=Frame%20299(1)(1).jpg)
(1).jpg?width=2000&name=Frame%20299(2)(1).jpg)
(1).jpg?width=2000&name=Frame%20299(3)(1).jpg)
(1).jpg?width=2000&name=Frame%20299(4)(1).jpg)
(1).jpg?width=2000&name=Frame%20299(6)(1).jpg)
(1).jpg?width=2000&name=Frame%20299(5)(1).jpg)
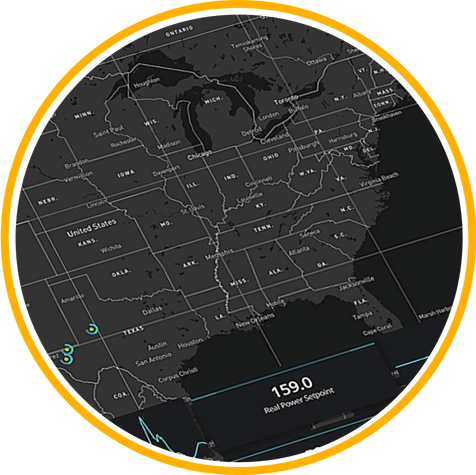 Our team designed custom maps on Mapbox and integrated them with Ignition, so they blend beautifully into the visual application theme.

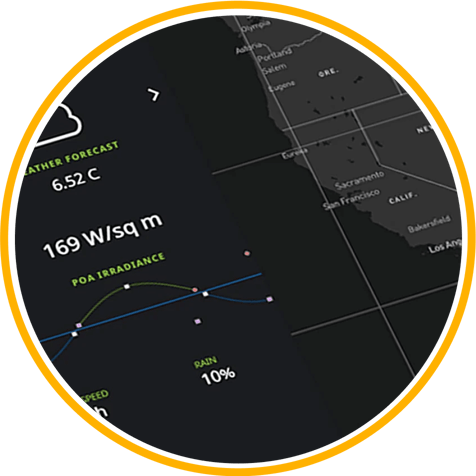 We integrated with Open Weather Maps and Windy.com to provide real-time weather updates for each site. We make real-time API calls to Open Weather Maps and Windy.com. We also leverage Windy.com's crisp map displays as needed throughout the system.
.png?width=750&height=679&name=247Support%201(1).png)